Smart QA Data Management in Radiotherapy and Imaging
Increase efficiency in QA data management. Streamline your QA workflow with Track-it.
Anytime. Anywhere. Paperless
The documentation and management of QA data and reports is a time-consuming process which requires a lot of administrative work and ties up valuable resources in radiotherapy and diagnostic imaging departments.
As a browser-based data management software, Track-it manages all your QA data on one single, easy-to-access platform. By automating workflow steps, it saves you time and ensures data consistency across your organization.
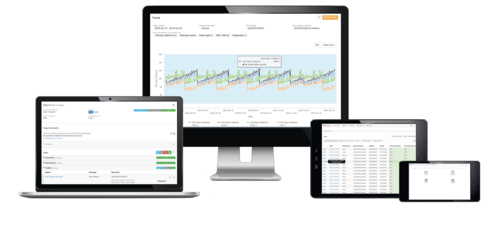
Track. Trend. Report.
Explore the advantages of a web-based QA data management solution for your everyday clinical work.
Effectively monitor QA data from multiple sources, devices or sites.
- Track and manage all of your QA data efficiently on one single platform and share it within your organization
- Export analyzed QA data from your PTW QA device to Track-it with the click of a single button. Add custom data manually or import external QA data via open XML interface – whenever you need it.
- Easily access your data from any network device simply by using a standard web browser, e.g., Chrome™, Firefox®, Internet Explorer® or Safari®.
- Effectively monitor and document your QA tasks as required by standard guidelines, e.g., AAPM TG-142 or DIN, using customizable protocol templates and smart Autofill functions.
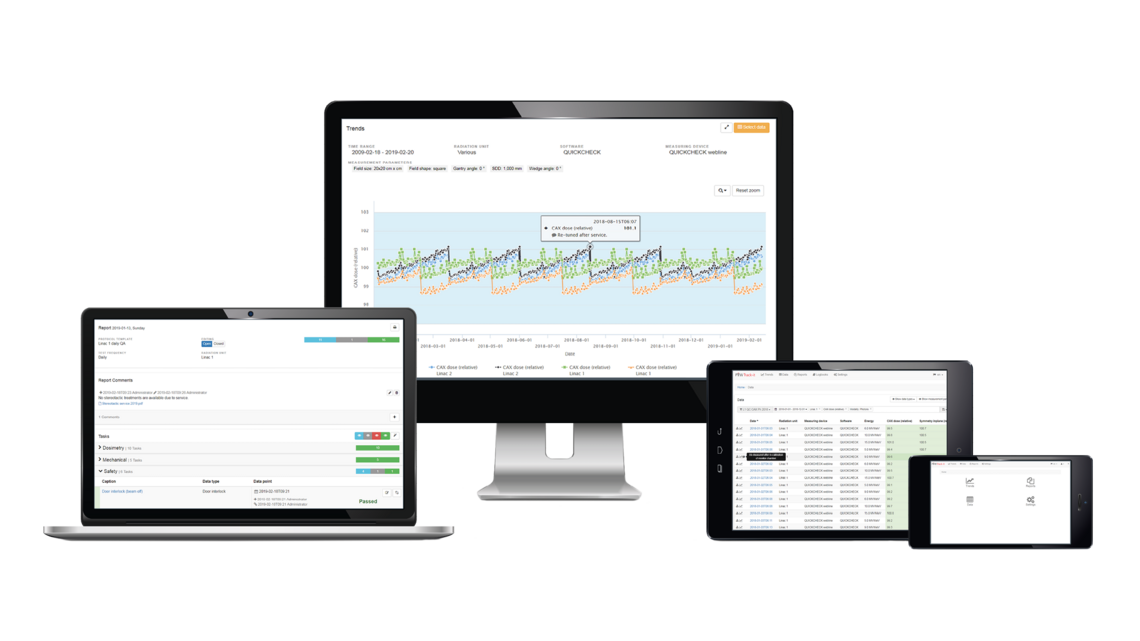
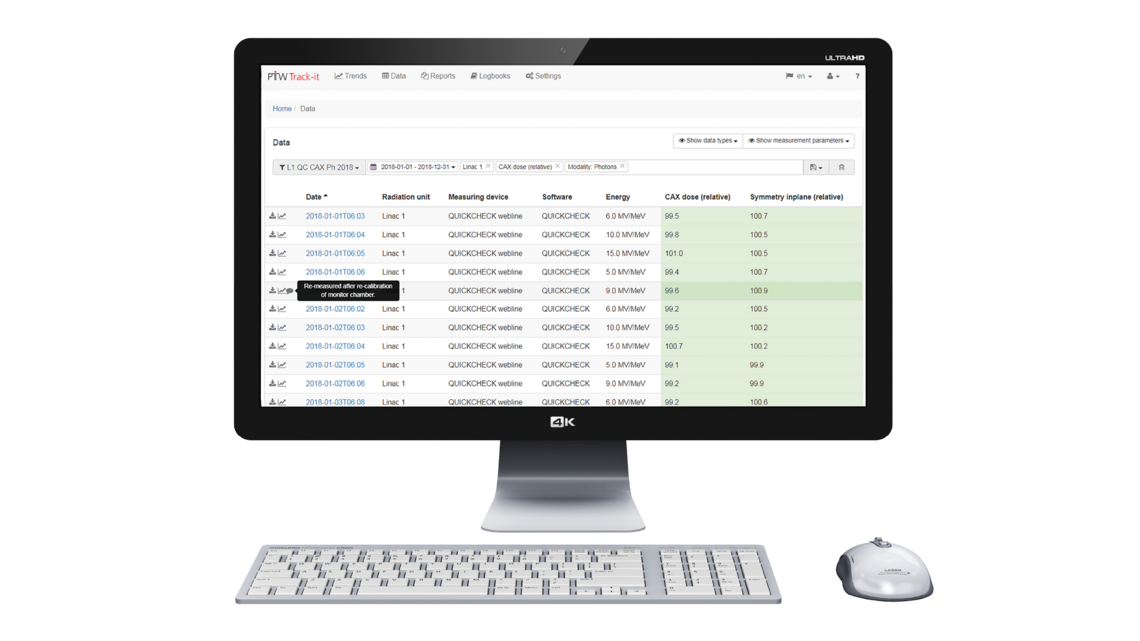
Efficiently manage all QA data on one single platform.
- Quickly access, browse and view QA data from any data source and from anywhere in your network.
- Customize filters to restrict data selection and save your filters for future use.
- Personalize your data view by adding and/or removing parameters or data types to see only the data that interests you, conveniently on one screen.
- Click a specific measurement for more detailed information, e.g., related data points, measurement conditions or interactive mini charts that give you a quick overview of trends.
- Immediately spot deviations of selected data types, e.g., CAX or symmetry.
- Add and/or edit data manually.
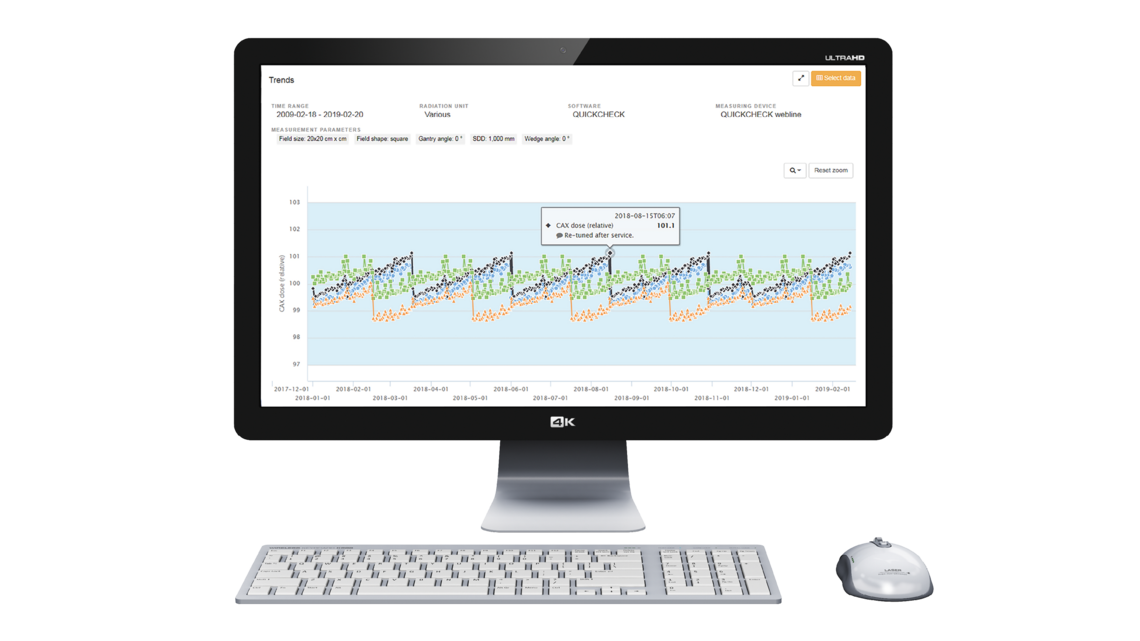
Easily track changes over time to take action when needed.
- Show trends of selected data types to recognize outliers and deviations from previously defined limits more easily.
- Restrict data for chart display using custom filters.
- Zoom in on any section of the chart to see the data trend over a shorter period of time.
- Move the mouse over single data points in your trend graph to view measurement results and/or further details.
- Edit and/or add comments to single data points.
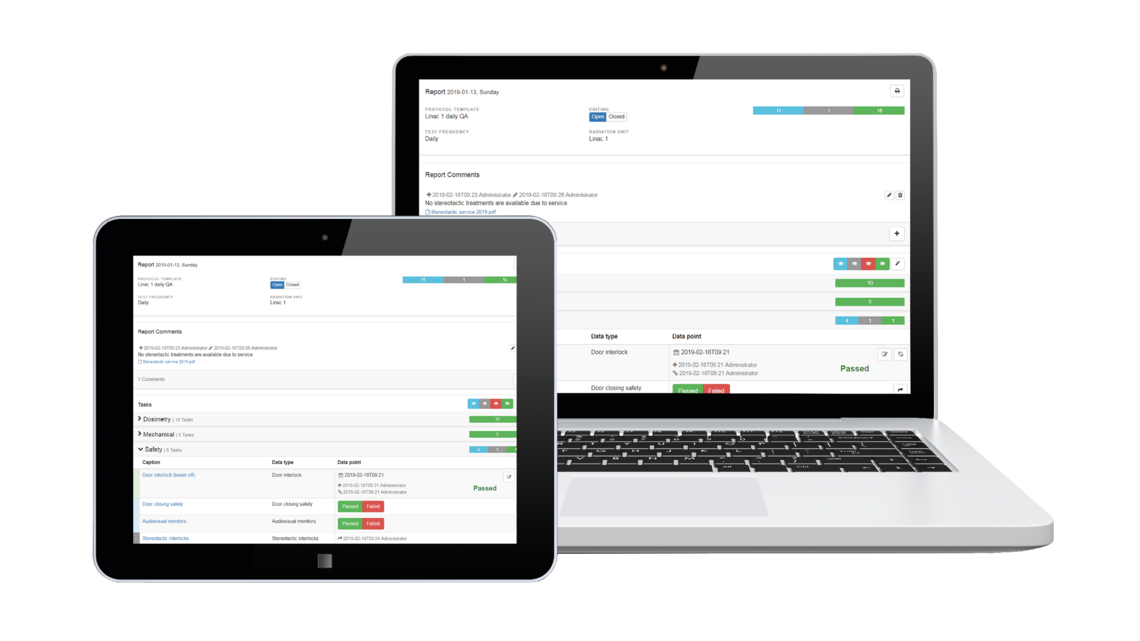
Conveniently monitor your QA tasks and document their results as required, in less time.
- Track the current status of your QA tasks (completed or open, pass or fail) from anywhere in your network.
- Use predefined or custom protocol templates, e.g., for AAPM TG-142 or DIN, to quickly collect the QA data you need.
- Save time by filling and/or updating your selected protocol automatically with the required QA data using Track-it Autofill.
- Add and/or edit data manually and save it in the Track-it database.
- Document results and print them for sign-off using preconfigured reports.
- Access tips and/or guidance on how to perform a specific test via the Info icon.
- Automatically archive completed protocols and retrieve saved documents any time you need them.
